|
|
|
|
| |
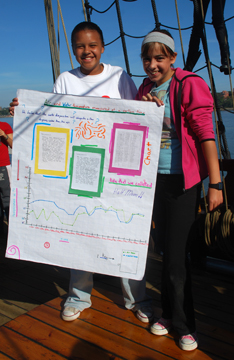
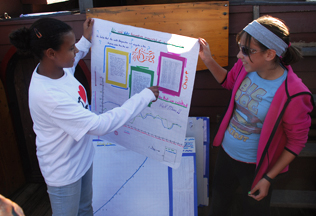
The final phase of the student projects was, of course, the presentation itself. The students spent the evening of Day Five and the morning of Day Six graphing the data they had collected and preparing written reports on their materials, methods, and conclusions to accompany their oral presentations. Each presentation was also accompanied by a round of questions, in which the students considered possible sources of error and ways these experiments could be improved in the future.
In the end, some students were able to support their theories, and in some cases the data produced results the students had not expected. But in every case, the students ended their Voyage of Discovery with a greater understanding of the natural world around them.
You can scroll down or use the links below to jump directly to a section.
|
|
Comparative Temperatures
|
|  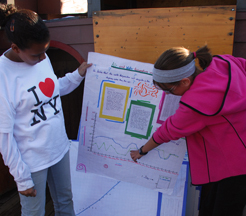
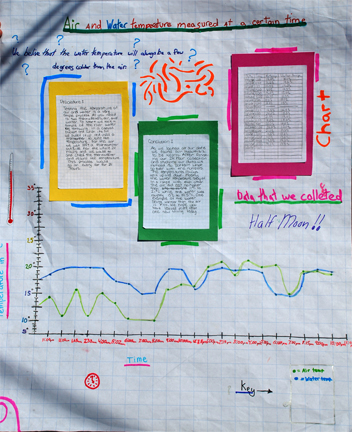
Students: Christina & Evi
Hypothesis: We believe that the water temperature will always be a few degrees colder than the air.
Materials: Thermometer, wet thermometer, canvas bucket.
|
|
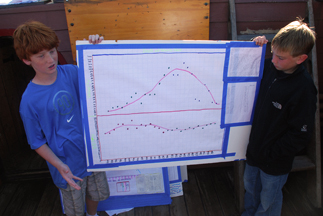
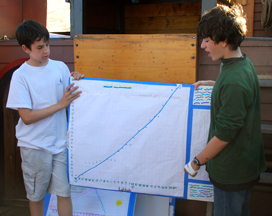
Line Graph: Air & Water Temperature/Time
|
Christina and Evi recorded air and surface water temperatures over a 24-hour period. On their graph, air temperature is in green, while water temperature is blue.
In the end, their data did not support their hypothesis; they found no strong correlation between the two temperatures.
Of course, a negative result is not a "wrong" answer -- eliminating unsupportable theories is an essential part of the scientific process.
|
Back to Top
|
|
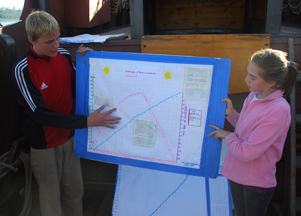 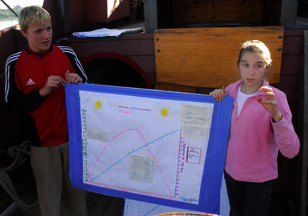
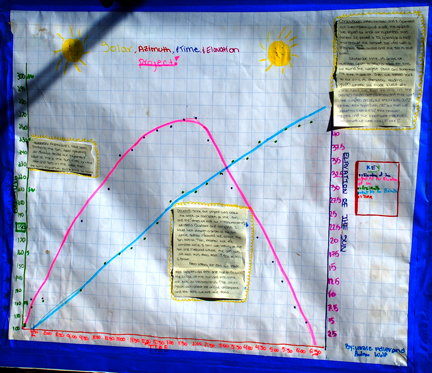
Students: Andrew & Lizzie
Hypothesis: Since the Sun rises in the east and sets in the west, then when the Sun' is at highest point its bearing must be due south.
Materials: Quadrant & directional compass.
|
|
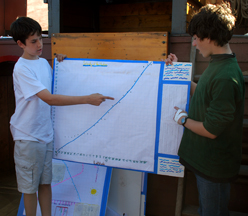
Line Graph : Azimuth & Altitude of the Sun/Time
|
Andrew and Lizzie tracked the course of the Sun from sunrise to sunset, seeking to find its azimuth at the moment the Sun reaches its highest point. On their graph, the pink line represents the Sun's altitude, while the blue line represents its azimuth.
Their data indicated that on October 13th the Sun reached true noon at 1330 hours, and that at that moment the Sun's azimuth -- the difference between due south and magnetic south -- stood at 8˚.
|
|
|
Tidal Patterns
|
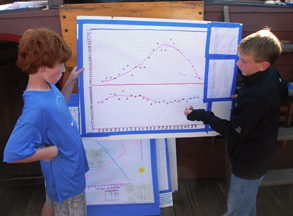 
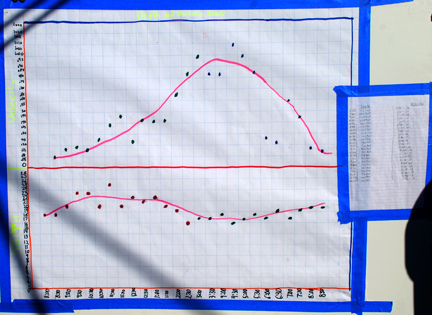
Students: Greg & Ross
Hypothesis: The current will go fastest during the ebb tide.
Materials: Lead line, tape measure, stopwatch, wooden biscuits.
|
|
Upper Graph: Current Speed/Time
Lower Graph: Height of Tide/Time |
Greg and Ross charted the height of tide and current patterns during a tidal cycle.
Their resulting data supported their hypothesis, indicating a clear rise in current velocity as high tide shifted to low tide.
|
|
Back to Top
|
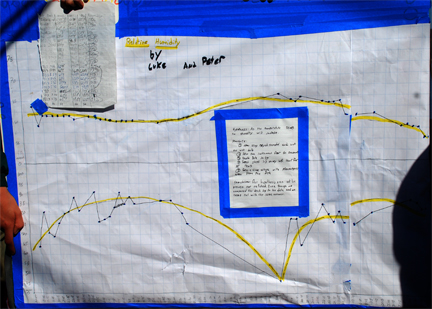
Relative Humidity |
Students: Luke & Peter
Hypothesis: When the air temperature drops the relative humidity will increase.
Materials: Sling psychrometer & thermometer.
|
|
Line Graph: Air Temperature and Relative Humidity/Time
|
Luke and Peter charted changes in air temperature and relative humidity over the course of a 24-hour period, with a particular focus on overnight data, when they believed changes in temperature and humidity would be most dramatic.
In the end, their data was inconclusive; although they did not find a strong correlation, they did discover some intriguing apparent patterns which they felt warranted further examination.
|
|
Back to Top
|
Salinity |
Students: Bennett & Jonathan
Hypothesis: Salinity levels will increase as we approach the ocean.
Materials: Canvas bucket, sample jars, GPS unit, refractometer.
|
|
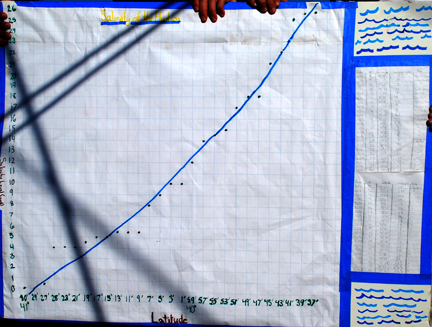
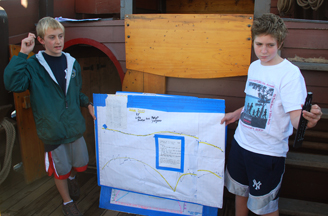
Line Graph: Salinity (in parts per thousand)/Minutes of Latitude
|
Bennett and Jonathan tested all the water samples collected between Newburgh and Grave's End Bay for salinity levels, taking exceptional care to eliminate instrument error by recalibrating the refractometer between each reading.
Their data strongly supported their hypothesis, showing a steady rise in salinity levels as the Hudson neared the Atlantic. At Grave's End Bay, we reached our maximum salinity count: 26 parts per thousand. (In the brackish environment at Yonkers, our final destination, average salinity tends toward 10 PPT.)
|
|
|
Mechanical Advantage
|
Students: Jena & Natalie
Hypothesis: If we lift up Mr. Chase about two feet high using blocks and rope then we can use the effort required to determine his weight.
Materials: Spring scale, lead ballast ingot, block & tackle system, Mr. Chase.
|
|
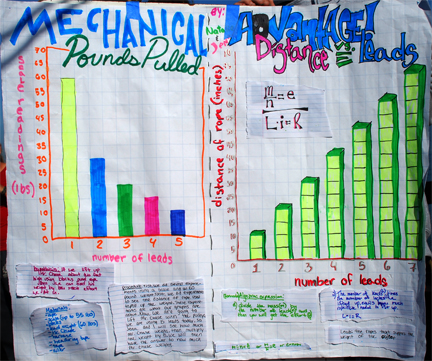
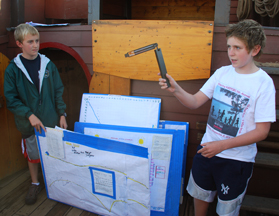
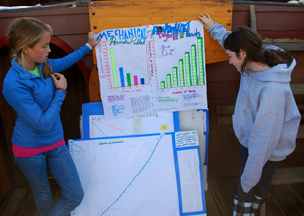
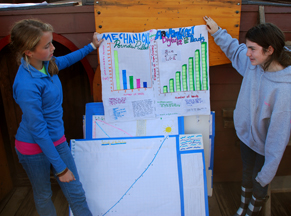
Left Bar Graph: Number of Leads/Required Force
Right Bar Graph: Number of Leads/Distance Pulled |
Jena and Natalie constructed a block-and-tackle simple machine, configuring it with one to five leads in order to lift a 60 lb. lead ingot.
With any given number of leads, they measured the amount of force needed to lift a given weight and the distance the line had to be pulled to lift the weight to a given height. From this data, they were able to formulate an equation that would allow them to theoretically extrapolate the force/distance requirements for any number of leads (barring friction).
For their presentation, Jena and Natalie predicted that their five-lead rig would divide the force needed to lift Mr. Chase by a factor of five. In practice, the spring scale indicated that Mr. Chase's apparent weight was 30 lbs., although his actual weight is 150 lbs. Strong support for their hypothesis!
|
|
|
|
|
|
|
|
|