 |
|
River SciencePage One Page Two |
|
The Replica Ship Half Moon is many things: an ambassador from history, a working sailing school, and a floating ecological laboratory. During their Voyage of Discovery, our student crew use this opportunity to integrate the study of history and science to understand the natural environment of the Hudson River Valley. |
Quick Links: Current Speed |
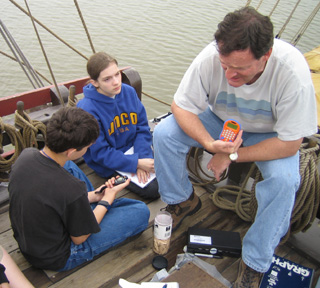
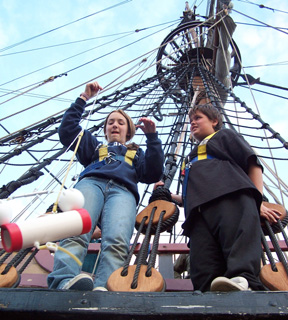
Current Speed
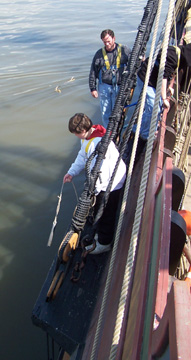
River current is an important factor when the Half Moon navigates on the Hudson River. For example, if we sail with the current, it can speed us along, but it slows us down when we sail against it. The Hudson is affected by the tides from its mouth in New York Harbor all the way up to Troy (location of the first dam on the Hudson River), so the speed of its current can vary considerably -- and even reverse itself -- several times a day as the tides ebb and flow. Above, you can see Mr. Linehan showing the student crew how to measure the current speed. (One factor to keep in mind is that the ripples visible on the water's surface don't tell us anything about the current; they're actually produced by the wind.) We use biodegradable wood chips to measure current speed. Students calculating the current speed toss one of these tiny chips into the river, then use a stopwatch to time it as the current carries it between two fixed points (such as the length of the weatherdeck). |
|
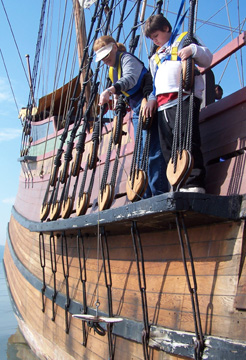
Water Clarity
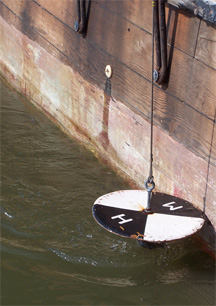
Water clarity (or turbidity) is determined by the amount of particles (such as silt or sediment) suspended in the water -- the higher the turbidity, the murkier the water. Water clarity is an important factor for aquatic life, since increased turbidity lowers the amount of sunlight reaching below the surface. On the Half Moon, we measure water clarity using a Secchi disk, a device first developed in 1865. (Hudson's crew would have simply judged water clarity by observing objects under water.) To use the Secchi disk, students must climb out onto the channel, so safety harnesses are required, as you can see to the right.
To measure turbidity, we lower the Secchi disk into the water until it is no longer visible. We then slowly pull the disk back up, recording the depth at which the Secchi disk's distinct markings become visible. Move your mouse over the image to the left to see the Secchi disk in use. |
|
Soundings
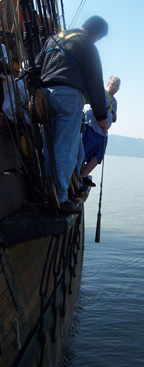
One of the most important factors for any ship sailing though uncharted waters is, naturally, water depth. Not only is the water depth often an unknown factor, it can change over time. In the short term, it can change by several feet a day as the tides rolls in and out. Over a longer period, silt can build up on the bottom, so even when a ship's crew has a river chart in hand, it's still a good idea to check the water's depth on your own. To measure water depth, our crews use a lead line (or sounding line). A sounding line is a long length of rope attached to a lead weight, which gives it its name. Individually marked flags mark 6-foot (1 fathom) increments all along its length. To take a sounding, a crewmember (such a Mr. Linehan, to the left, or Daymien, to the right) dons a safety harness, steps onto the channel, and flings the lead weight into the water, letting the line run through his fingers. When he feels the weight hit bottom, a quick glance at how many flags went into the river tells him exactly how deep the water is at that location. |
|
Water Temperature
For much of its length, the Hudson River is deep enough that numerous qualities, such as water temperature, can vary significantly between the surface and the lower depths. To the right, you can see Kiera and Daymien using our Van Dorn sampler, which allows us to measure river phenomena like water temperature, oxygen levels, or salinity (see below) at any depth we choose, rather than just at the surface. As you can see, a Van Dorn sampler is a hollow tube, open at both ends. Its user lowers the sampler into the water to the desired depth, then drops a weight down its guide line, which triggers the stoppers at each end to snap shut and trap a water sample inside, which can then be quickly pulled back up for analysis. Of course, it's important to take a sounding before using the Van Dorn sampler; otherwise, we might accidentally sink it into the silt at the river's bottom. |
|
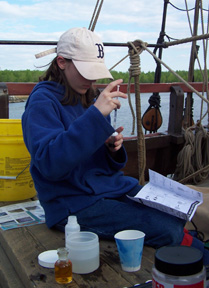
Oxygen Levels
Our student crew also studied dissolved oxygen levels in the river, an important indicator of water quality and a major factor in the river ecology. Both oxygen levels that rise too high and those that fall too low can be dangerous for aquatic widlife. Just a few decades ago, oxygen levels in the Hudson were so low that long stretches of the river could not support life. Fortunately, the river ecology has been allowed to recover, and its wildlife has returned. To the left, you can see Emily performing one of a series of titrations tests to measure dissolved oxygen in Athens Channel. A titration test is a multi-step chemical test that uses color changes to indicate dissolved oxygen levels. By using the Van Dorn sampler, our students were able to compare readings from the suface with those taken from lower depths. |
|
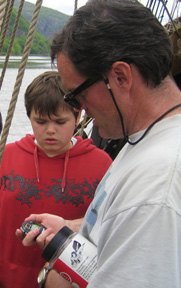
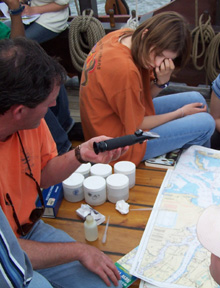
Salinity
The Hudson River is an estuary: a freshwater river that flows into the ocean, where it mixes with salt water. The degree of mixture between fresh and salt water is called the salinity gradient. On the Hudson, the salinity gradient at a given location can vary considerably depending on factors such as time of year, tidal flow, and precipitation. Salinity can be measured by using a refractometer, the tool which Mr. Linehan is demonstrating for Samantha to the left. This instrument measures salinity using refraction, the degree to which light bends as it passes through different materials. Saltier water bends light farther than fresher water, so someone who knows how to read a refractometer user can check salinity levels with just a glance. Salinity can also be measured through tritration. In some cases, the students measured salinity using both methods and compared their findings.
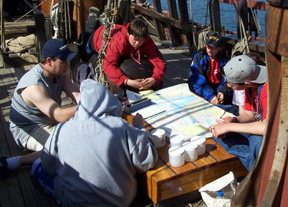
While the Port Watch studied salinity for their group report, all of the students also participated in an exercise like the one you can see to the right. After using a refractometer to measure the salinity gradient in various water samples, they were able to accurately predict where on the river the samples had been taken.
|
|