 |
|
|
|
| |
The final phase of the student projects was, of course, the presentation itself. The students spent the morning and afternoon of Day Six graphing the data they had collected and preparing written reports on their materials, methods, and conclusions to accompany their oral presentations. These presentations were delivered that evening, after the Half Moon had docked in Glastonbury. Each presentation was also accompanied by a round of questions, in which the students considered possible sources of error and ways these experiments could be improved in the future.
In the end, some students were able to support their theories, and in some cases the data produced results the students had not expected. But in every case, the students ended their Voyage of Discovery with a greater understanding of the natural world around them.
You can scroll down or use the links below to jump directly to a section.
|
|
Air Pressure, Humidity, & Temperature
|
|  
Students: Danielle & Tahari
Senior Crew Advisor: Gary Coolidge
Instruments: Barometer, hygrometer, and thermometer.
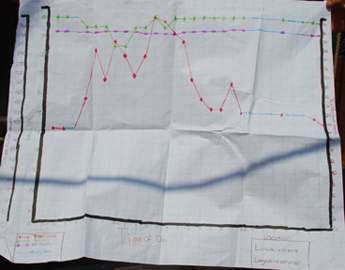
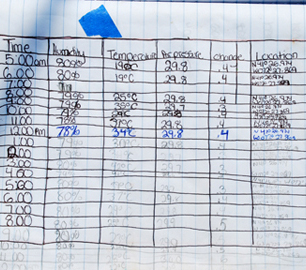
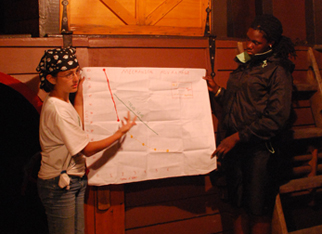
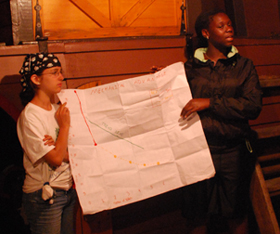
Danielle and Tahari took measurements of three separate weather parameters to determine the relation between them. In their presentation they discussed the effects of cloud cover and storm activity upon their measurements of barometric pressure, air temperature, and relative humidity. Their final graph was constructed to show the relationship between these parameters and contained over 24 hours of data.
|
|
|
Line Graph: Air Temperature/Barometric Pressure/Humidity |
Data Sheet |
|
Back to Top
|
|
Students: Jessica & Nora
Senior Crew Advisor: Gary Coolidge
Instruments: Calculator, croutons, wooden biscuit, measuring tape, stopwatch.
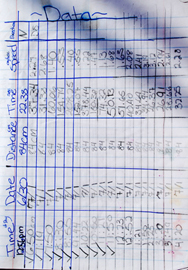
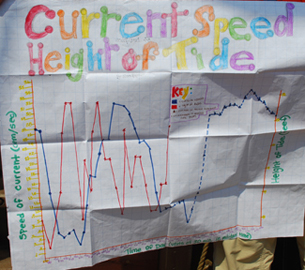
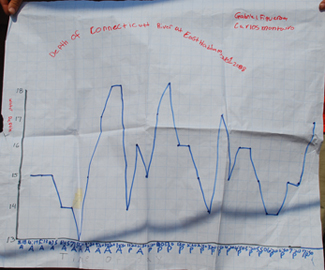
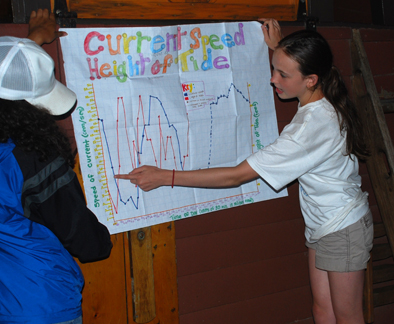
Jessica and Nora conducted an experiment to measure the speed of the Connecticut River while the Half Moon was docked at East Haddam. They measured the speed by placing a wood chip or crouton in the river and timing its journey from two fixed points on the weather deck. They also tested for error by "racing" different flotation materials against each other: chips vs. croutons, and pre-soaked materials vs. dry. They then graphed their data and compared it to Carlos and Gabriel's data on tidal height.
|
|
|
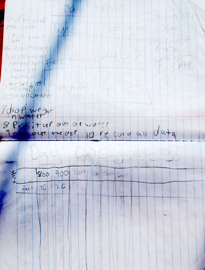
Data Sheet |
Line Graph: Current Speed & Height of Tide/Time |
|
|
Height of Tide
|
Students: Carlos & Gabriel
Senior Crew Advisor: Bob Wardwell
Instruments: Lead line.
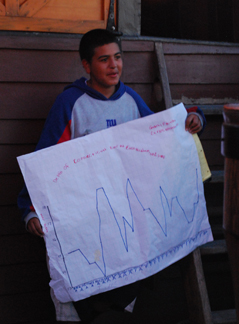
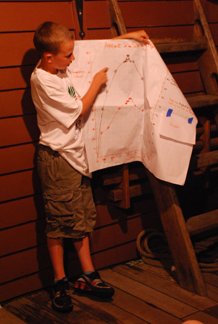
Carlos and Gabriel used a lead line to sound the water's depth at East Haddam over a 24-hour period. This is a traditional and reliable method that was in use on Henry Hudson's ship in 1609. Their readings showed a steady fluctuation in the height of tide, and shared their data with Jessica and Nora, showing a possible loose correlation between height of tide and local tidal currents.
|
|
|
Line Graph: Water Depth in Feet/Time |
Data Sheet |
|
Back to Top
|
Height of Sun & Atmospheric Conditions |
Students: David & Nick
Senior Crew Advisor: Jennifer Reilly
Instruments: Barometer, compass, digital thermometer, quadrant.
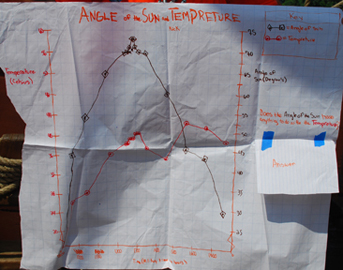
David and Nick oberserved the altitude and azimuth (bearing) of the sun throughout the day to determine local noon and true South. Using a compass and a quadrant, they increased their sampling frequency as they approached their projected local noon. Through additional observations, they investigated correlations between sun position and air temperature and humidity.
|
|
|
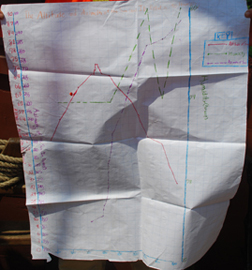
Line Graph: Altitude and Azimuth of Sun/Relative Humidity |
Line Graph: Angle of Sun/Air Temperature |
|
Back to Top
|
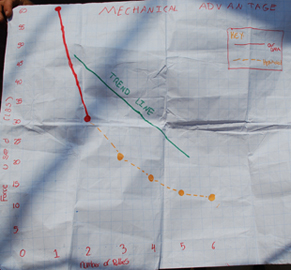
Mechanical Advantage |
Students: Carolann & Oksãna
Senior Crew Advisor: Sarah Read
Instruments: Spring scale, lead ballast ingot, block & tackle system.
After their first-hand experiences with sail handling and the rig, Carolann and Oksãna were able to apply the applications of mechanical advantage on a working square-rigged sailing vessel. To determine the relationship between force needed to lift a weight and number of blocks (pulleys) used, the two designed a model rig on the weather deck and were able to develop a formula out of their test results. Ultimately, they used this formula to design and implement a rig to lift Ms. Reilly one foot off the deck, and to calculate her weight from their results.
|
|
|
Line Graph: Force Used (in Pounds)/Number of Leads |
Data Sheet |
|
|
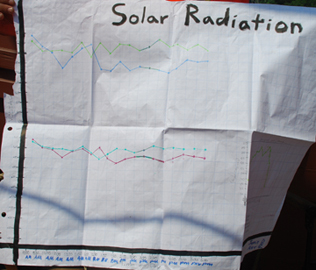
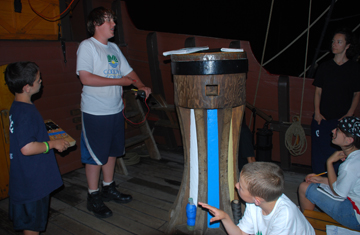
Solar Energy
|
Students: Alex & Jamie
Senior Crew Advisor: Jurgen Schuijer
Instruments: Compass, quadrant, solar panel array, voltometer.
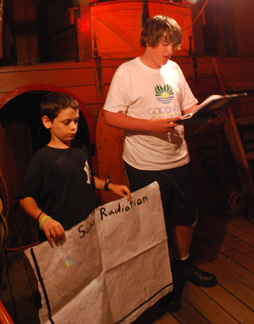
Alex and Jamie's presentation involved both solar energy and celestial tracking. Like David and Nick, they used a compass to record the sun's azimuth (bearing) and a quadrant to measure its altitude. They would then use a voltometer to measure the energy output of a solar cell array posititoned on the capstan. They compared and contrasted several variants, including the accuracy of using one solar panel vs. two in terms of data collection, and the differing levels of solar radiation captured by using a horizontal solar panel vs. one angled to face the sun.
|
|
|
Line Graph: Height of Sun and Solar Energy Output/Time |
Data Sheet |
|
|
|
|
|
|
|
|