 |
|
|
|
| |
The final phase of the student projects was, of course, the presentation itself. The students spent the afternoon of Day Four and the morning of Day Five graphing the data they had collected and preparing written reports on their materials, methods, and conclusions to accompany their oral presentations. Each presentation was also accompanied by a round of questions, in which the students considered possible sources of error and ways these experiments could be improved in the future.
In the end, some students were able to support their theories, and in some cases the data produced results the students had not expected. But in every case, the students ended their Voyage of Discovery with a greater understanding of the natural world around them.
You can scroll down or use the links below to jump directly to a section.
|
|
Comparative Temperatures
|
| 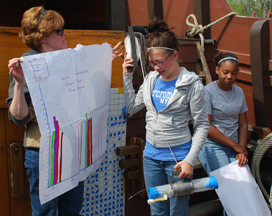 
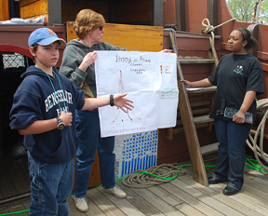
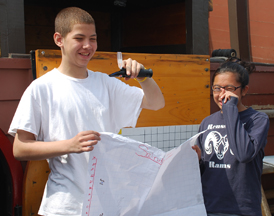
Students: Kristie & Sienna
Senior Crew Advisor: Virginia Mahigian
Instruments: Digital thermometer, wet thermometer, canvas bucket, Van Dorn sampler.
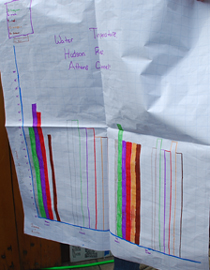
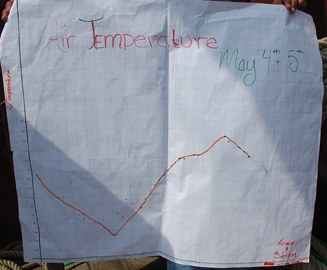
Krisite and Sienna's research compared the temperature of the air to that of river water sampled both at and below the surface. They measured air and surface water temperatures over a 24 hour period as the Half Moon traveled from Beacon to Athens. While at Athens Channel, they used a Van Dorn sampler to measure water temperatures though the water column, at a location where the water averaged 18 feet in depth.
Air temperature was recorded in degrees Fahrenheit. Water temperature was recorded in degrees Celsius, then converted to Fahrenheit for their graph. Their results varied, theoretically due to environmental conditions -- rainfall, a relatively shallow water column at Athens Channel, and so forth.
|
|
|
Bar Graph: Water Temperature/Depth |
Line Graph: Air Temperature/Time |
|
Back to Top
|
|
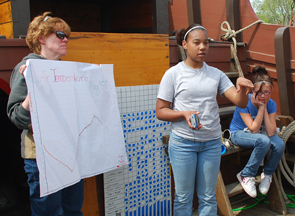
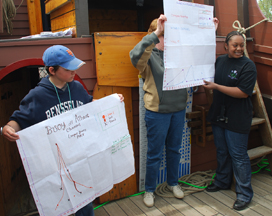
Students: Casey & Jesse
Senior Crew Advisor: Steve Linehan
Instruments: Lead line, wood biscuits, stopwatch.
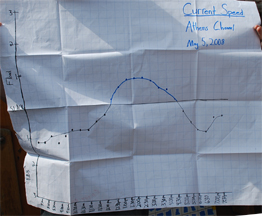
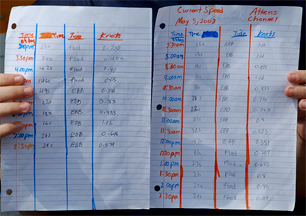
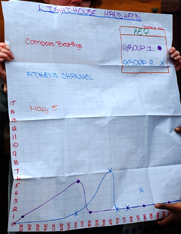
Casey and Jesse measured the speed of the current at Athens Channel, recording their readings in knots (nautical miles per hour). They graphed the estuary's current pattern over a twelve-hour period, and we able to clearly distinguish the ebb, slack, and flood tides.
|
|
|
Line Graph: Current Speed/Time |
Data Sheets |
|
|
Lines of Position
|
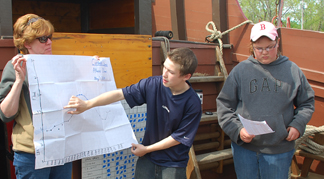
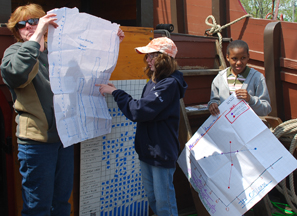
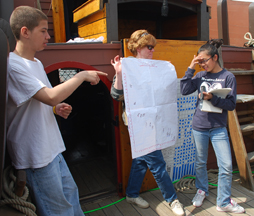
Students: Daniella & Jacob
Senior Crew Advisor: Captain William Reynolds (and the whole crew!)
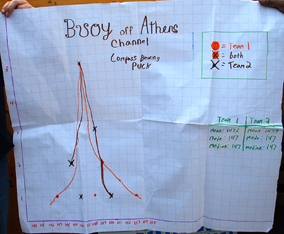
Instruments: Directional compass (two varieties: hand-held and "puck").
Daniella and Jacob's presentation centered around the accuracy of lines of position. First, they divided the Half Moon crew into two teams. At Athens Channel, they had each crew member use a directional compasses to find the compass bearing of two fixed objects: a channel beacon and a lighthouse. Two different types of instruments were used: a hand-held compass, marked in units of +-5˚ (error margin 2.5), and a "puck" compass, marked in units of 1˚ (error margin .5) . They then recorded the bearings reported by the participants. These bearings produced differing results, which may have been due to user and/or intrument error. For example, the compass users may not all have been placed in the same location, and the ship itself may have shifted in its moorings.
Jacob and Daniella then created line graphs of their statistical findings.
|
|
|
Line Graph: Coordinates Reported for Buoy/Number of Respondants |
Line Graph: Coordinates Reported for Lighthouse/ Number of Respondants |
|
Back to Top
|
Mechanical Advantage |
 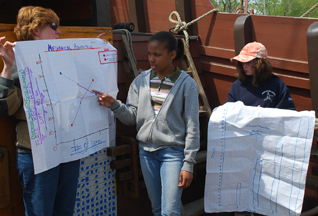
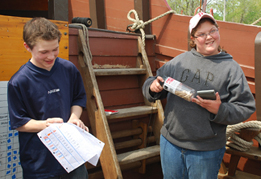
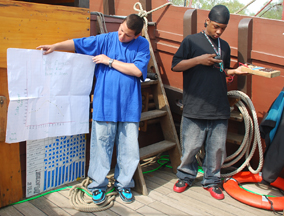
Students: Jasmine & Mary
Senior Crew Advisor: Ned Chalker
Instruments: Spring scale, lead ballast ingot, block & tackle system, hook, tape measure.
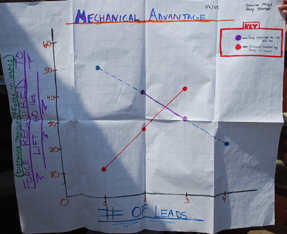
Jasmine and Mary studied mechanical advantage through the use of simple machines. Using a ballast weight and a block-and-tackle rig, Jasmine and Mary measured the force needed to lift a 60 lb. weight 12 inches by usine 1, 2, 3, or 4 leads. They found a correlation between an increase in the number of leads and a decrease in the necessary lifting force, but acknowledged that instrument error -- such as elasticity in the lines or friction -- may have an affect on this pattern.
|
|
|
Bar Graph: Distance Lead Pulled to Lift 60 Lb. Weight/Number of Leads |
Line Graph: Force Required to Lift 60 Lbs./Number of Leads |
|
Back to Top
|
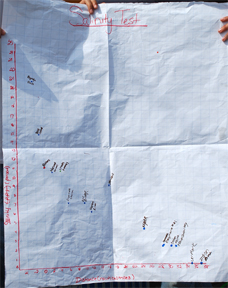
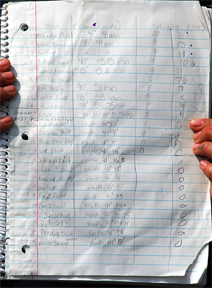
Salinity |
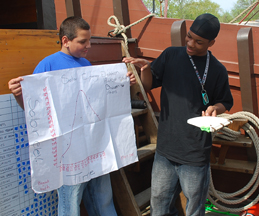
Students: Muhammad & Thwe-Thwe
Senior Crew Advisor: Mary Ellen Jacobs
Instruments: Canvas bucket, sample jars, GPS unit, refractometer.
Muhammad and Thwe-Thwe studied the salinity gradient in Hudson River water, measured in parts per thousand (ppt). Using a refractometer to measure salt content, they record 22 ppt at Bay Ridge Flats (New York Harbor); the ocean is known to be roughly 35 ppt. Using a GPS unit during our travels, they continued to take samples at a series of waymarks, ceasing only after their testing found the salt had been diluted to 0 ppt (fresh water) as we passed Indian Point, located just south of the Bear Mountain Bridge. (On Voyages of Discovery in the fall, we often find salt water north of the Newburgh-Beacon Bridge.) It was theorized that seasonal conditions -- including recent rains and spring runoff -- had diluted the estuary.
Muhammed and Thwe-Thwe also calculated the distance between their first and final salinity tests in nautical miles in order to graph their findings.
|
|
|
Slope Line Graph: Salinity/Distance from Ocean |
Data Sheet |
|
|
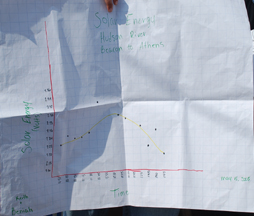
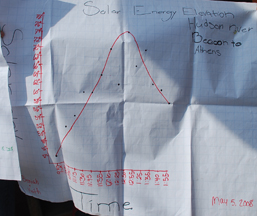
Solar Energy
|
Students: Beniah & Keith
Senior Crew Advisor: Kipp van Aken
Instruments: Quadrant, compass, solar panel array, voltometer.
Beniah & Keith's presentation involved both solar energy and tracking the position of the sun. They used a solar panel array to calculate the energy being produced by the sun in volts. They also used a compass to take the sun's bearing and a quadrant to measure the angle of the sun from their location.
When combined, their research showed a clear correlation between the sun's energy and its elevation.
|
|
|
Line Graph: Solar Energy/Time |
Line Graph: Solar Elevation/Time |
|
|
|
|
|
|
|
|