 |
|
|
|
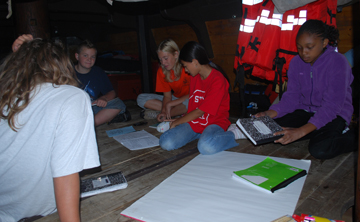
The students spent the morning of Day Seven working together on the orlop deck to analyze their data and prepare written graphs.
|
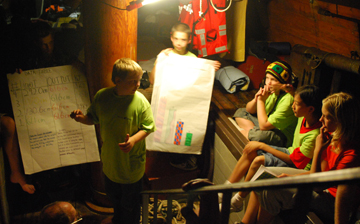
In the evening, after the ship's arrival at Verplanck, the entire crew came together on the orlop deck to receive the students' reports. Although both teams had collected the same data, each used different methods to arrive at their results.
Port Watch was first to take the stage, with Ben and Pwint taking the lead to demonstrate their findings.
|
|
|
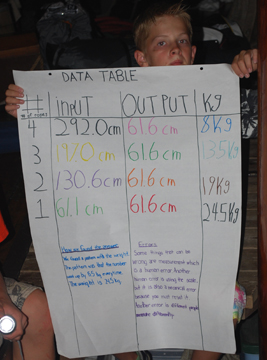
Port Watch Data Table |
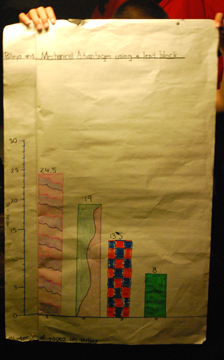
Bar Graph: Required Force by Number of Leads/Output Distance |
|
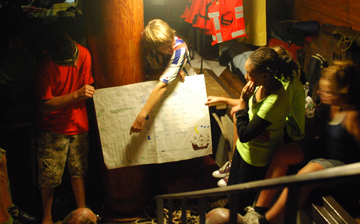
Starboard Watch came next, with Raynika stepping forward to speak, backed up by José in particular.
|
|
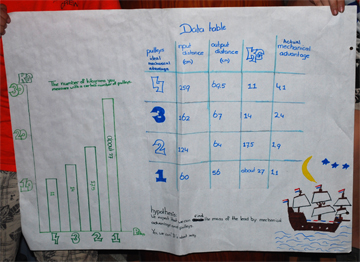
Starboard Watch Bar Graph (Force/Leads)
and Data Table |
|
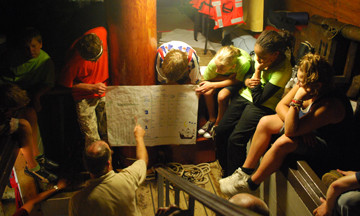
Both teams acknowledged some human error in their work -- possibly during data collection, and possibly during analysis. The question-and-answer period which followed led to an intensive number-crunching session, as the students and educators discussed the realities of human error and sought to uncover the true data.
|
|
|
|
|
|