 |
|
|
|
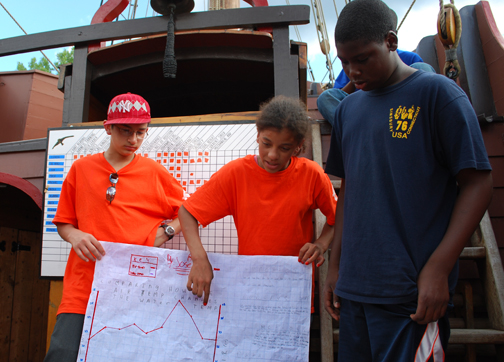
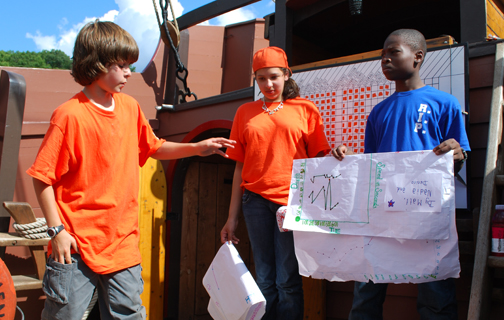
The final phase of the student projects was, of course, the presentation itself. The students spent the afternoon of Day Five and the morning of Day Six graphing the data they had collected and preparing written reports on their materials, methods, and conclusions to accompany their oral presentations. Each presentation was also accompanied by a round of questions, in which the students considered possible sources of error and ways these experiments could be improved in the future.
|
Presentation Project Topics |
|
|
|
|
In the end, some students were able to support their theories, and in some cases the data produced results the students had not expected. But in every case, the students ended their Voyage of Discovery with a greater understanding of the natural world around them.
You can scroll down or use the links to jump directly to a section.
|
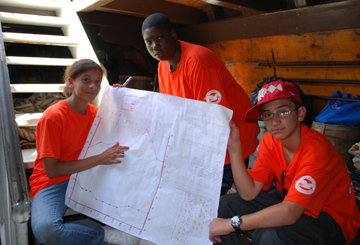
Research Team 1: Celestial Tracking
|
| 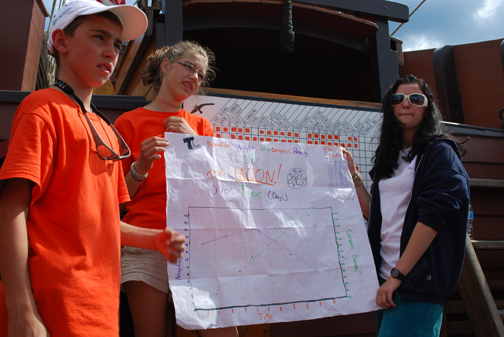
Students: Michael, Loren, & Elaina
Senior Crew Advisor: Mary Ellen Jacobs
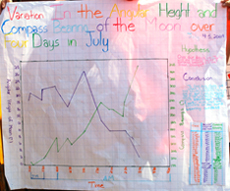
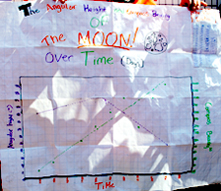
Hypothesis: Does the angular height and compass bearing of the Moon change over four nights and, if so, what is the pattern of change?
Materials: Quadrant, directional compass.
Although a pattern was starting to emerge, the team's data from tracking the Moon did not show enough of a pattern to strongly support their hypothesis. The team was interested in continuing their project, and felt that additional time and training would produce stronger results. |
|
|
 |
Line Graph: Variations in Angular Height & Compass Bearing of the Moon over Four Days in July |
Line Graph: Angular Height & Compass Bearing of Moon/Time |
Line Graph: Variations in Angular Height & Compass Bearing of the Moon over Four Days in July |
|
Back to Top
|
Research Team 2: Mechanical Advantage
|
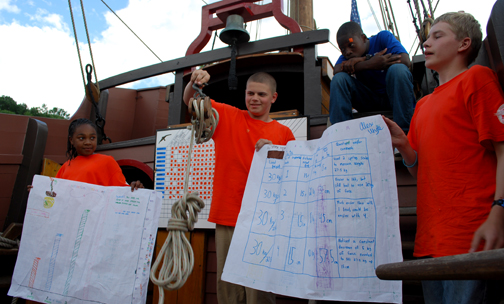
Students: Tajanae, Jon, & Alex
Senior Crew Advisor: Ewout van Grondelle
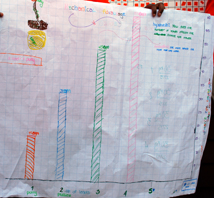
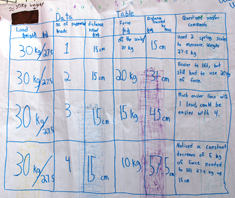
Hypothesis: Does the number of leads used affect the force required to lift a set weight 15 cm? Does the number of leads affect the distance that the rope must be pulled for the same effect?
Materials: Spring scale, lead ballast ingot, block & tackle simple machine.
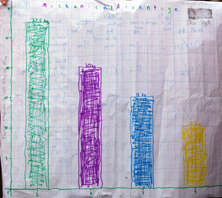
The team demonstrated the block-and-tackle simple machine they used in their mechanical advantage experiment and pointed out several other simple machines in use on board, including the levers in the whipstaff and bilge pumps and the wheel-and-axle principle of the capstan. Their data demonstrated a clear and predictable pattern: for each downward lead added to the machine, the force needed to lift a 60 lb. load 15 cm off the deck decreased, but the length of line needed to pull it increased. From their data, they were able to extrapolate the actual weight of the ingot, which overwhelms the spring scale when the machine uses just a single lead.
|
|
 |
|
Bar Graph: No. Leads/ Distance Line Travels
|
Bar Graph:
No.
Leads/Required Force |
|
|
|
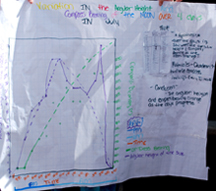
Research Team 3: Comparative Temperatures
|
Students: Jose, Alanna, & Tyron
Senior Crew Advisor: Deb Cowles
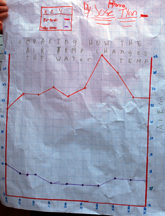
Hypothesis: If the air temperature rises, the water temperature will also rise, but not as dramatically.
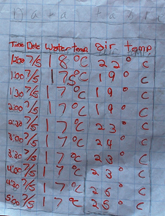
Materials: Digital thermometer, wet thermometer, canvas bucket, Van Dorn sampler.
|
|
Line Graph: Air Temp. and Water Temp./Time |
Data Table |
The team's data indicated that air temperature did fluctuate more wildly than water temperature, but a predictable pattern remained elusive. The team's presentation also led to a vigorous discussion on how the presentation of data can be manipulated to exaggerate or conceal its results. In this case, the air temperature (in red) seems to spike dramatically in the afternoon; while one side of the debate offered various possible reasons for this data point (ranging from human error to a break in the cloud cover), the other side noted that this "spike" actually represented a rise of a mere 2˚ Celsius, which would hardly be noticable in human terms. Regardless, it was also noted that the comparatively steep rise in air temperature was shortly followed by a mild rise in water temperature, offering mild support for their hypothesis. The team agreed that additional time and training would strengthen their results.
|
Back to Top
|
Research Team 4: Current Patterns & Depth of Tide |
Students: DeNiro, Matt, & Nadia
Senior Crew Advisor: Captain Reynolds
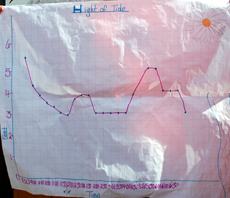
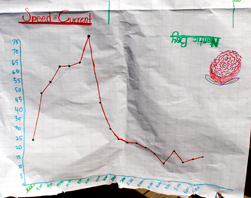
Hypothesis: The wind will affect the tidal current, and the tide will go up and down.
Materials: Lead line, wooden biscuits, stopwatch, calculator, stale bagels, hand held anemometer.
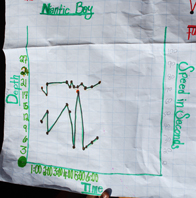
After comparing current speed and direction with wind speed and direction, the team's data did not support the idea that wind will affect current speed. Their data did produce some results indicating that the tide goes up and down, but research needs to continue over a longer period of time to establish a pattern.
|
|
|
 |
Line Graph: Height of Tide/Time at East Haddam |
Line Graph: Speed of Current/Time at East Haddam |
Line Graph: Depth and Current Speed/Time in Niantic Bay |
|
|
|
|
|
|