 |
|
|
|
|
|
First Leg Presentations | Second Leg Presentations |
|
On their last night onboard the Half Moon, our student crews culminate their educational experience by delivering reports on various scientific topics they've studied while on the Hudson. The educational crew of the Half Moon designs these studies to enable students to observe, measure, and analyze natural patterns in the world around them. We stick to basic methods of gathering data, using devices that help the student gain insight about the workings of the world (as opposed to just reading an LED from a digital probe). Students also use primary source documents from the 17th century as well as collecting their own source data to generate their own primary source documents. This spring, we shifted from having students deliver individual presentations to having them work as teams, organized according to their duty watches (Port Watch and Starboard Watch). We were extremely satisfied with this little experiment -- the resulting cooperation resulted in more thorough data gathering and helped strengthen the bonds of teamwork as they delegated duties within their watches. We have thus continued with the team approach on this Voyage of Discovery. Each team member focuses on his or her own, individual field of study, while still assisting other crewmates where needed. The watches then combine their specialized areas of knowledge in collaborative research and presentation. Not only is this method reflective of how Hudson's crew would have worked in 1609, it also mirrors how modern scientific study is typically conducted today. Each team has one hour to deliver their reports and field questions from the rest of the crew. On the first leg of this Voyage of Discovery, Starboard Watch studied water science while Port Watch analyzed weather science. The students offered their presentations on the warm, sunny afternoon of September 20th, while we sat at anchor off Henry Hudson Park.
|
|
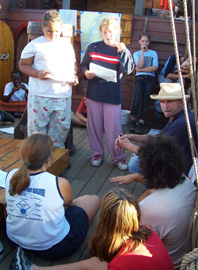
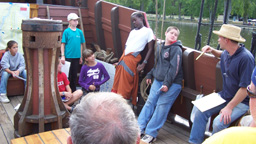
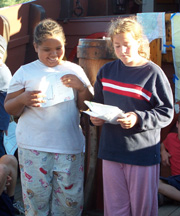
Starboard Watch: Water ScienceAt 1600 hours, we gathered on the weather deck. We quickly decided that Starboard Watch would go first, presenting their studies of various river-related phenomena. |
|
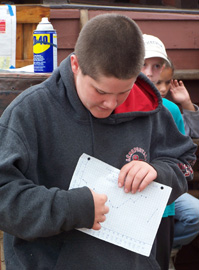
Keith was the first to approach the capstan. He discussed water clarity, also called turbitity, and graphed how clear or cloudy the water had been over the course of a day. As he wrapped up his aspect of the Starboard presentation, he took a few questions as to how our varying weather might have affected his findings. |
|
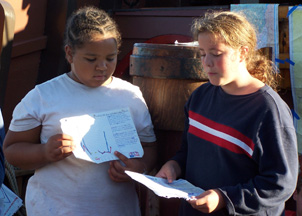
Kathleen then stepped forward, delivering her findings on water temperature. She and Katie also demonstrated the use of a Van Dorn sampler, which they had both used extensively in their research. Kathleen had taken temperature readings throughout the day and at various water depths, yet oddly her findings showed no fluctuation in the water's temperature. This is unusual, and raised the possibility of equipment failure (such as a malfunctioning thermometer). Although the temperature readings themselves may be untrustworthy, the issue of unexpected factors affecting one's data gathering still proved to be a valuable scientific lesson. |
|
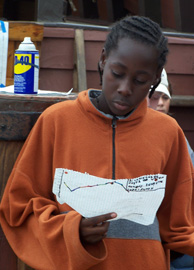
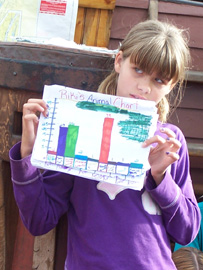
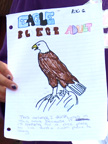
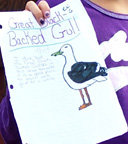
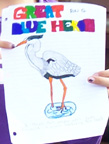
Finally, Riki came forward to present her studies of the Hudson Valley's avian wildlife. She presented the crew with illustrations of many of the birds she had observed along the river (including the bald eagle, great black-backed gull, and great blue heron below), and also offered a bar graph of her bird sightings, indicating possible relative population levels. (Unsurprisingly, sea gulls are much more commonly sighted than bald eagles.) During questioning, she also discussed where on the river (such as on the water itself, wading in shallow wetlands, and so forth) she had sighted each species, analyzing their preferred habitats. |
|
   |
|
As Riki wrapped up, Starboard Watch came together as a team to spend the few minutes remaining in their hour to address questions from the audience. |
|
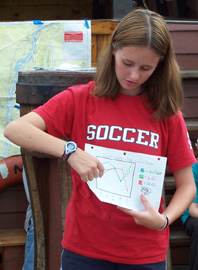
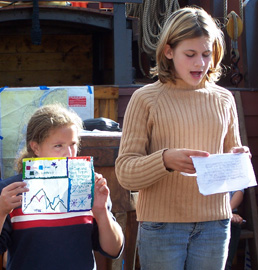
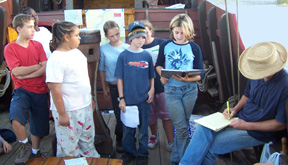
Meaghan was first up, presenting her data on celestial positioning as Ericka helpfully help up her charts. Meaghan had used a quadrant to track the course of the sun and the moon throughout a full 24-hour cycle. Her data showed some irregularities at night, when reading swere being taken by various crew members on anchor watch. This raised the possibility of human error. Like the equipment failure Kathleen may have encountered above, this is an important factor to take into account when gathering or analyzing data, and was itself a valuable lesson learned.
|
|
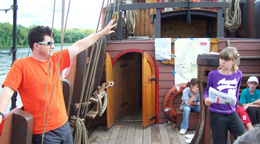
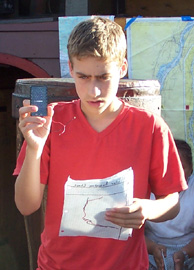
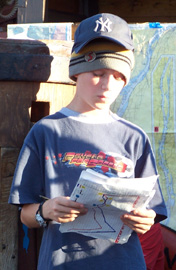
Adam was next to take center stage. He had focused his research on solar energy, using a photovoltaic cell to measure the electricity it generated via sunlight throughout the course of the day. Due to our contentious weather, his research also included contrasts between densely overcast and clear skies. Here Adam demonstrates the use of the photovoltaic cell and his chart of the resulting energy output. This raised some intriguing questions as to how solar power might be utilized on board a ship like the Half Moon. |
|
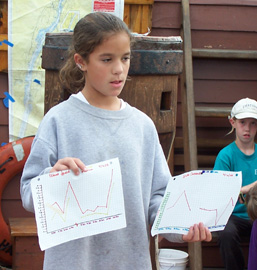
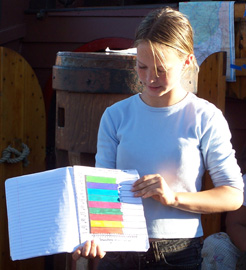
Madena and Ericka then shared the limelight to offer their presentation. Working as a team, they had charted wind speed throughout an entire day. Each half hour, they would take turns simultaneously measuring the wind speed at the level of the weather deck with that of the main mast top. They noted that the wind was generally faster as the higher elevation, and this led to discussion of why that might be and how a ship like the Half Moon might put those findings to use. |
|
After Kyle concluded his report and took a few questions, Port Watch came together as a group for a final question & answer session, this time with a focus on how their various topics might interact with each other. |
|