 |
|
|
|
|
|
First Leg Presentations | Second Leg Presentations |
|
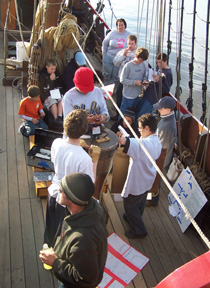
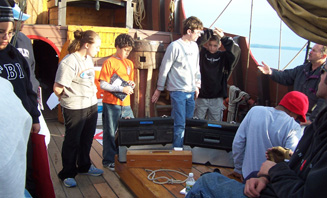
On their last night onboard the Half Moon, our student crews culminate their educational experience by delivering reports on various scientific topics they've studied while on the Hudson. The educational crew of the Half Moon designs these studies to enable students to observe, measure, and analyze natural patterns in the world around them. We stick to basic methods of gathering data, using devices that help the student gain insight about the workings of the world (as opposed to just reading an LED from a digital probe). Students also use primary source documents from the 17th century as well as collecting their own source data to generate their own primary source documents. This spring, we shifted from having students deliver individual presentations to having them work as teams, organized according to their duty watches (Port Watch and Starboard Watch). We were extremely satisfied with this little experiment -- the resulting cooperation resulted in more thorough data gathering and helped strengthen the bonds of teamwork as they delegated duties within their watches. We have thus continued with the team approach on this Voyage of Discovery. Each team member focuses on his or her own, individual field of study, while still assisting other crewmates where needed. The watches then combine their specialized areas of knowledge in collaborative research and presentation. Not only is this method reflective of how Hudson's crew would have worked in 1609, it also mirrors how modern scientific study is typically conducted today.
|
|
|
October 17th: Subjects for the team presentations have been assigned. Starting tomorrow, Port Watch will study water science while Starboard Watch studies weather science. |
|
|
October 18th: Our educational crew members introduce the students to their presentation sciences. Starboard Watch goes over a preliminary look at the research topics possible within weather science, while Port Watch practices taking water samples. That done, the students select their individual topics. Starboard Watch: Amro will tackle wind speed, David will study barometric pressure, Nate will research solar energy, Nick will focus on comparative air/water surface temperatures, and Sam will study relative humidity. Port Watch: Alex S. will measure water depths, Alex X. will current speed, Candice will study dissolved oxygen levels, Kris will monitor water clarity, Matt will research salinity, and Zach will sample water temperatures at different depths. |
|
October 19th: The students have been introduced to the scientific instruments they'll be using and have been given most of the afternoon to practice with them. By the end of the day, each student has also prepared a preliminary hypothesis to test during his or her research tomorrow; these hypotheses may be refined as the experiments begin.
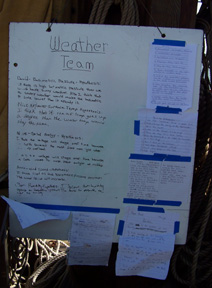
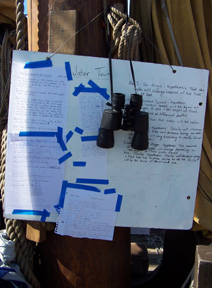
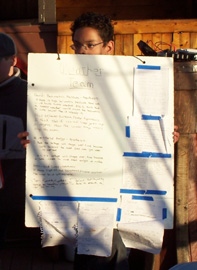
Weather Team Hypotheses Amro: Wind Speed David: Barometric Pressure Nate: Solar Energy I think the voltage will change over time during the day because the Earth receives the most direct sunlight at midday. Nick: Air/Water Surface Temperature Sam: Humidity
Water Team Hypotheses Alex S.: Soundings Alex W.: Current Speed Candice: Dissolved Oxygen Kris: Clarity Matt: Salinity Zach: Temperature at Different Depths |
|
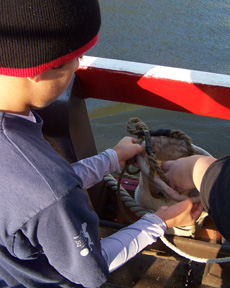
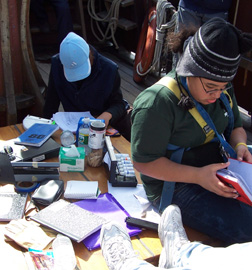
October 20th: We spend the entire day resting at anchor in New York Harbor so the students can focus on their research projects. Having developed their hypotheses, they spend a full 12 hours gathering data, working from 0800 hours to 2000 hours. Or at least that's the plan; as it happens, the students coordinate their efforts so well and gather so much data that, once the sun sets at 1800 hours, the crew decides to wrap up early. You can visit today's log to see more photos of the data gathering process. |
|
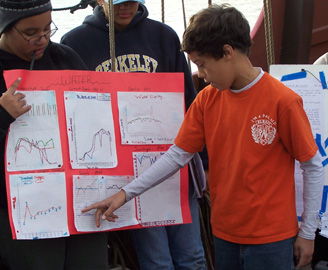
Alex S. stepped forward first to discuss her soundings. She demonstrated the use of a lead line and graphed the rise and fall of the tides on Bay Ridge Flats over the course of a full day, with an overall change in depth similar to what she predicted in her hypothesis. During questioning, she theorized that minor irregularities in her depth findings may have been caused by the wind and tides moving the ship around its anchorage, so that she was not, in fact, always testing the water's depth in the exact same location. |
|
Next, Alex W. presented her findings on current speed. After explaining the mathematic equation she had used to determine current speed, she applied her findings to her hypothesis that the current speed at the height of the ebb tide would equal that at the height of the flood tide. Indeed, her findings seemed to support this theory. In addition, by measuring the current, Alex W.'s research tied in directly to many of her teammates' projects. |
|
It was then Matt's turn to discuss salinity. He demonstrated how to use a refractometer, then turned to his hypothesis, which was that salinity levels would increase during a flood tide (when seawater rushes into the estuary) and decrease during an ebb tide (when the Hudson's water runs out to sea). He was able to support this hypothesis with his research data.
|
|
Candice now took the opportunity to present her findings on dissolved oxygen levels. After explaining how to conduct a titration test, Candice turned to her data. In her hypothesis, she had theorized that dissolved oxygen levels would drop at lower depths, but the differences she found in her research were minor, at least at our anchorage. During questioning, she theorized that one might find more significant contrasts in oxygen levels if conducting research in an area with a more stronger ecology (such as riverside wetlands, as opposed to our urban surroundings). |
|
Zach stepped forward next, delivering his research into water temperatures at various depths and demonstrating how to use a Van Dorn sampler. Zach had theorized that water temperature would drop at lower depths, which he was able to demonstrate with his research, though the difference was minor. While fielding questions, Zach suggested that temperature differences would be more significant in deeper waters. |
|
Lastly, Kris discussed water clarity. He demonstrated how to use a Secchi disk, then turned to his voluminous data. In his hypothesis, Kris had theorized that clarity would improve during an ebb tide and decrease during a flood tide, but he found the opposite to be true during his research. That's perfectly fine; hypotheses are meant to be tested. |
|
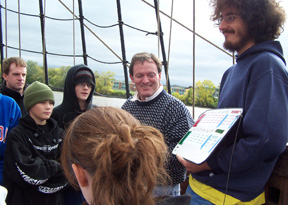
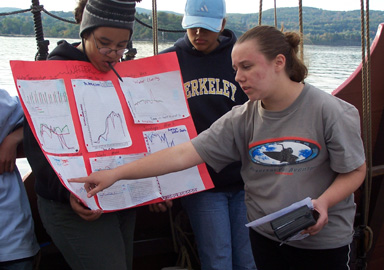
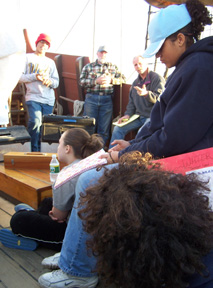
As the Port Watch students concluded their presentations, they fielded questions from Captain Reynolds and other members of the crew, leading to some intriguing discussions. |
|
Nick came first with his comparison of air and water surface temperatures. In his hypothesis, Nick had theorized that he would see more temperature changes in the air than in the water, and this was borne out by his research. In fact, water temperatures remained fairly steady throughout the day. During questioning, Nick theorized that a researcher might find more significant temperature shifts on a longer time scale (such as a season or a year). |
|
Next, Sam presented his research into relative humidity. Sam focused his presentation on the sometimes different humidity levels he had recorded with each of the two instruments he had used -- the sling psychrometer and the whirling hydrometer -- and demonstrated their use. |
|
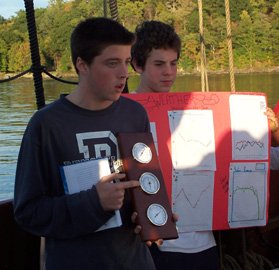
David then stepped forward to discuss barometric pressure. As he had theorized in his hypothesis, he did find a connection between barometric pressure and inclement weather -- lower pressure was often accompanied by cloudy skies. He also demonstrated the usage of the barometer he had used in his research. |
|
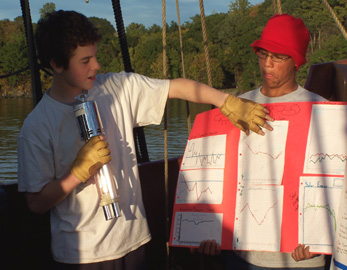
Nate then stepped up to the capstan, delivering his solar energy research. Along with demonstrating how to use photovoltaic cells and quadrants, Nate was able to chart the rise and fall of energy output from the sun as it rose and set. During questioning, he theorized that the photovoltaic cell received more energy when sunlight struck it at more direct angles, and suggested that such a cell should be designed to face the sun directly (perhaps even moving with the sun) to maximize its solar energy input. |
|
Amro concluded the Starboard presentation with his findings on wind speed. He demonstrated how to use a hand-held anemometer, then connected his research to David's. Indeed, similarl to what his hypothesis had predicted, Amro did find a connection between changes in barometric pressure and wind speed, possibly caused by different air masses moving through the atmosphere. |
|
Finally, Starboard Watch wrapped up the procedings by taking a few more questions from Captain Reynolds and other members of the audience. |
|