 |
|
When the original Half Moon first ventured up the Hudson River in 1609, its crew paid close attention to the vibrant environment surrounding them, looking for ways to utilize the region's abundant natural resources. |
Quicklinks Water Science Weather Science Other Fields |
Today, on board the replica ship Half Moon, we still pay special attention to the natural world around us. The Half Moon acts as a floating ecological laboratory. Our students utilize a mixture of modern and period tools and instruments to collect their data, mixing science and history into a unified whole. This page will be updated each day as our student crew learns about each new aspect of the river. |
|
Soundings
|
|
Water Clarity
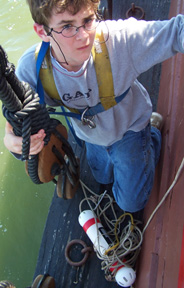
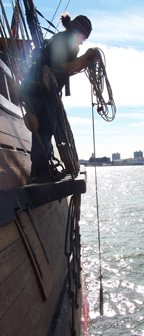
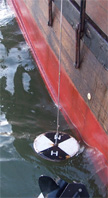
Particles suspended in the river (such as silt, sediment, or plant material) determine the water's clarity (also called turbidity). Simply put, the higher the turbidity, the murkier the water. High turbidity can diffuse sunlight as it penetrates the water's surface, possibilty even affecting the local flora and fauna. In the photos here, you can see Kris using a Secchi disk to measure the turbidity of the Bay Ridge Flats for his final project. Hudson's voyages predate the invention of the Secchi disk by more than two centuries; in the 17th century, sailors would simply keep an eye on objects floating beneath the water's surface.
|
|
Move your mouse over the image to the left to see the Secchi disk in use. A Secchi disk works like a lead line, except that instead of flinging a lead line overboard, its user simply lowers the disk into the water. Once the Secchi disk itself fades out of view, Kris checked the markings on his line to see how far down into the water the disk went before it faded from view. Kris took a second reading when he pulled the disk back up, then compared the results. In fact, Kris went above and beyond in his data collecting, taking two readings from each side of the ship every half hour (for a total of eight readings per hour).
|
|
Current Speed
|
|
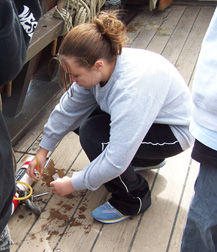
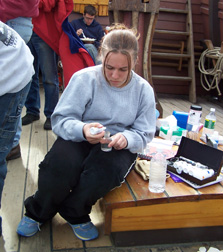
Dissolved Oxygen Levels
Candice chose to study dissolved oxygen levels over the course of a day for her share of the team project. Testing her theory that the oxygen levels would differ at various depths. Just a few decades ago, the Hudson River was so badly polluted that readings taken during the summer often showed no oxygen in the water. Without oxygen, a river's ecology literally suffocates, and indeed, the Hudson was just barely capable of supporting life. Fortunately, the Hudson has greatly recovered from those days, to which the healthy dissolved oxygen levels we've found on our Voyages of Discovery can attest. To measure dissolved oxygen levels over the course of a day, Candice performed a series of titration tests, as seen above. A titration test is a complex chemical procedure that uses changes in color to indicate the level of oxygen present in a given water sample. |
|
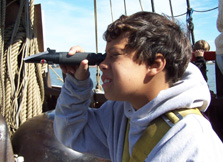
Salinity
The Hudson River is an estuary: a freshwater river that flows into the ocean, where it mixes with salt water. The degree of mixture between fresh and salt water is called the salinity gradient. On the Hudson, the salinity gradient at a given location can vary considerably depending on factors such as time of year, tidal flow, and precipitation. Salinity levels have an immediate effect on the surrounding ecology, since many aquatic creatures can survive only in either "salt" or "fresh" water. It's just as important for sailors, who need a fresh water supply to survive. For his project, Matt used a refractometer (above) to measure salinity levels using refraction: the degree to which light bends as it passes through different materials. Saltier water bends light farther than fresher water, so a trained refractometer user can check salinity levels with just a glance. (Sailors in Hudson's day would have had to simply go by taste.) Matt theorized that salinity levels would be affected by sample depths and currents, and was able to support this with his research. |
|
Water Temperature
The Hudson River's depth fluctuates wildly as one sails up its length. In many places, most notably just off West Point, the water is so deep that its ambient temperature often varies considerably between the bottom and the surface. Although water temperature has relatively little effect on the Half Moon or her crew (with the exception of extreme temperatures, as Captain Hudson understood while battling the polar ice during his arctic expeditions), it can have obvious effects on the local ecology. Zach opted to study the water temperature in New York Harbor for his part of the team presentation. To measure water temperatures at different depths, Zach made good use of our Van Dorn sampler (left). This hollow tube can be lowered to a desired depth in the water. A little jiggling then snaps the tube shut, trapping a water sample inside which can then be retrieved for analysis (right). This ability to take readings from varying depths was a vital step not just for Zach's research project, but also for those of Candice and Matt. Zach was able to support his hypothesis that the water would be colder at deeper depths, but found it difficult to take accurate readings due to the strong, tidal currents of the Bay Ridge Flats. Because the current tended to pull the Van Dorn sampler in a horizontal direction rather than letting it simply sink to the bottom, Zach couldn't be sure of the actual depths he was recording. Zach concluded his report with possible suggestions on how to counter this problem on future Voyages of Discovery. |
|
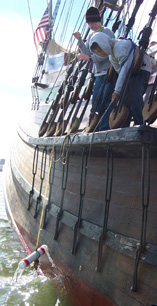
 When traveling through uncharted waters, one of the most basic questions a ship's crew needs to be able to answer is also one of the most important: How deep is the water? In fact, as Juet's journal entries in our daily logs show, Captain Hudson and his crew repeatedly faced the danger of running aground while exploring the river.
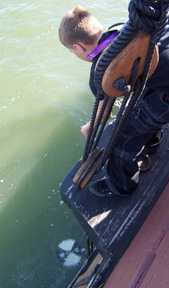
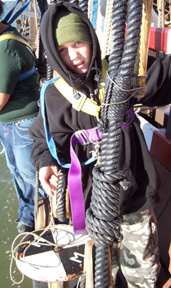
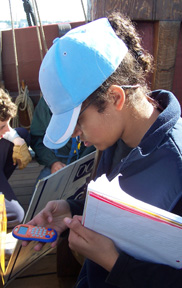
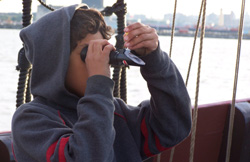
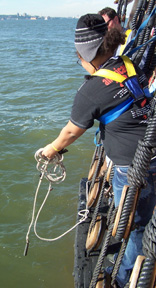
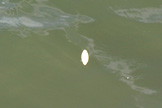 Measuring the current is trickier than it looks. Our new crew members quickly learn that waves rippling across the water's surface don't tell us anything about the current; they're actually caused by the wind (and, with practice, can even be used to estimate wind speed). Waves may not tell us about the current, but debris floating in the water can. To measure the current, Alex W. would toss a biodegradable wood chip into the water (left), then time how long the chip takes to float down the length of the weather deck. To the right, Alex W. is performing the quick math needed to determine where the water is pushing us and how long it'll take to get there.